
STAT6171001 – Basic Statistics
Member of :
- Arvin Yuwono (2502009721)
- Christopher Alexander Tjiandra (2502019230)
- Christopher Owen (2502019180)
CHAPTER I
PROBLEM ANALYSIS
Music is one of the most impactful arts in human history. Music can be defined in more than one way based on its characteristics and features. Initially, music is defined as a sound consisting of melody, harmony and rhythm, and properly organized in time (Ajibola, 2019). Music is one of the energy sources of humans and can give various colours to the world. Without music, people’s lives will be empty and certainly boring.
The history of world music begins in the 2nd century and the 3rd century BC. Originally, it was used to accompany religious ceremonies. Then alterations occurred in the Middle Ages, due to significant changes in conditions in the world. With the development of an increasingly advanced era, music was divided into several sections, referred to as Genres. Generally, Genre is a grouping of music according to their resemblance to one another and can be defined by musical techniques, styles, contexts, as well as musical themes. In today’s world, there are many genres of music exist in the world. “According to the popular music streaming service Spotify, there are over 1,300 music genres in the world” (Ivan and Cara, 2017).
As stated previously, thousands of genres have existed and taken turns claiming the most favourite genre every year. For example, in 2018 in the United States, a survey was made and the result stated that pop music was the favourite music genre of 52% of respondents aged 16 to 19 years old, even though the classic rock was the top music genre for the people graphically (Statista, 2021). Another example from Statista in 2022, R&B and hip-hop is the leading genre for the whole year with 29.9% in streamed music consumption, followed by rock with 17%. According to Statista, the song “Levitating” created by Dua Lipa is the most popular song in the United States in 2021, with 804.7 million streams in a single year (Statista, 2022). Moreover, the song is classified as a pop, disco, and electro genre, according to Google. From the examples above, it can be seen that music genres can replace each other every year depending on the listeners and creators in the specific year. Some of the features can consider for every user in listening to a certain music genre such as beats per minute, energy, valence, and others that can change the user’s mood or feel throughout the music. Other than that, it may also affect the popularity of a song. By knowing that, it can be concluded that some of the genres take turns in claiming the most popular genre every year. However, it is not known which genres specifically have the highest popularity. From that, a dataset is taken and the purpose of this study is to reveal which music genre is the most popular and what the biggest factor that supports the popularity of that music genre.
Next chapter
CHAPTER II
HYPOTHESIS
From the given problem above, the following hypothesis is made:
- Ho: Pop genre is not the most popular genre and both energy and valance do not have an impact on the popularity of the genre statistically.
- H1: Pop genre is the most popular genre and both energy and valance have an impact on the popularity of the genre statistically.
Illowsky, B. & et al. (2022) explain the relationship between the sample mean and population mean:
In a population whose distribution may be known or unknown if the size (n) of samples is sufficiently large, the distribution of the sample means will be approximately normal. The mean of the sample means will equal the population mean. The standard deviation of the distribution of the sample means called the standard error of the mean, is equal to the population standard deviation divided by the square root of the sample size (n).
Next Chapter
CHAPTER III
DATASET
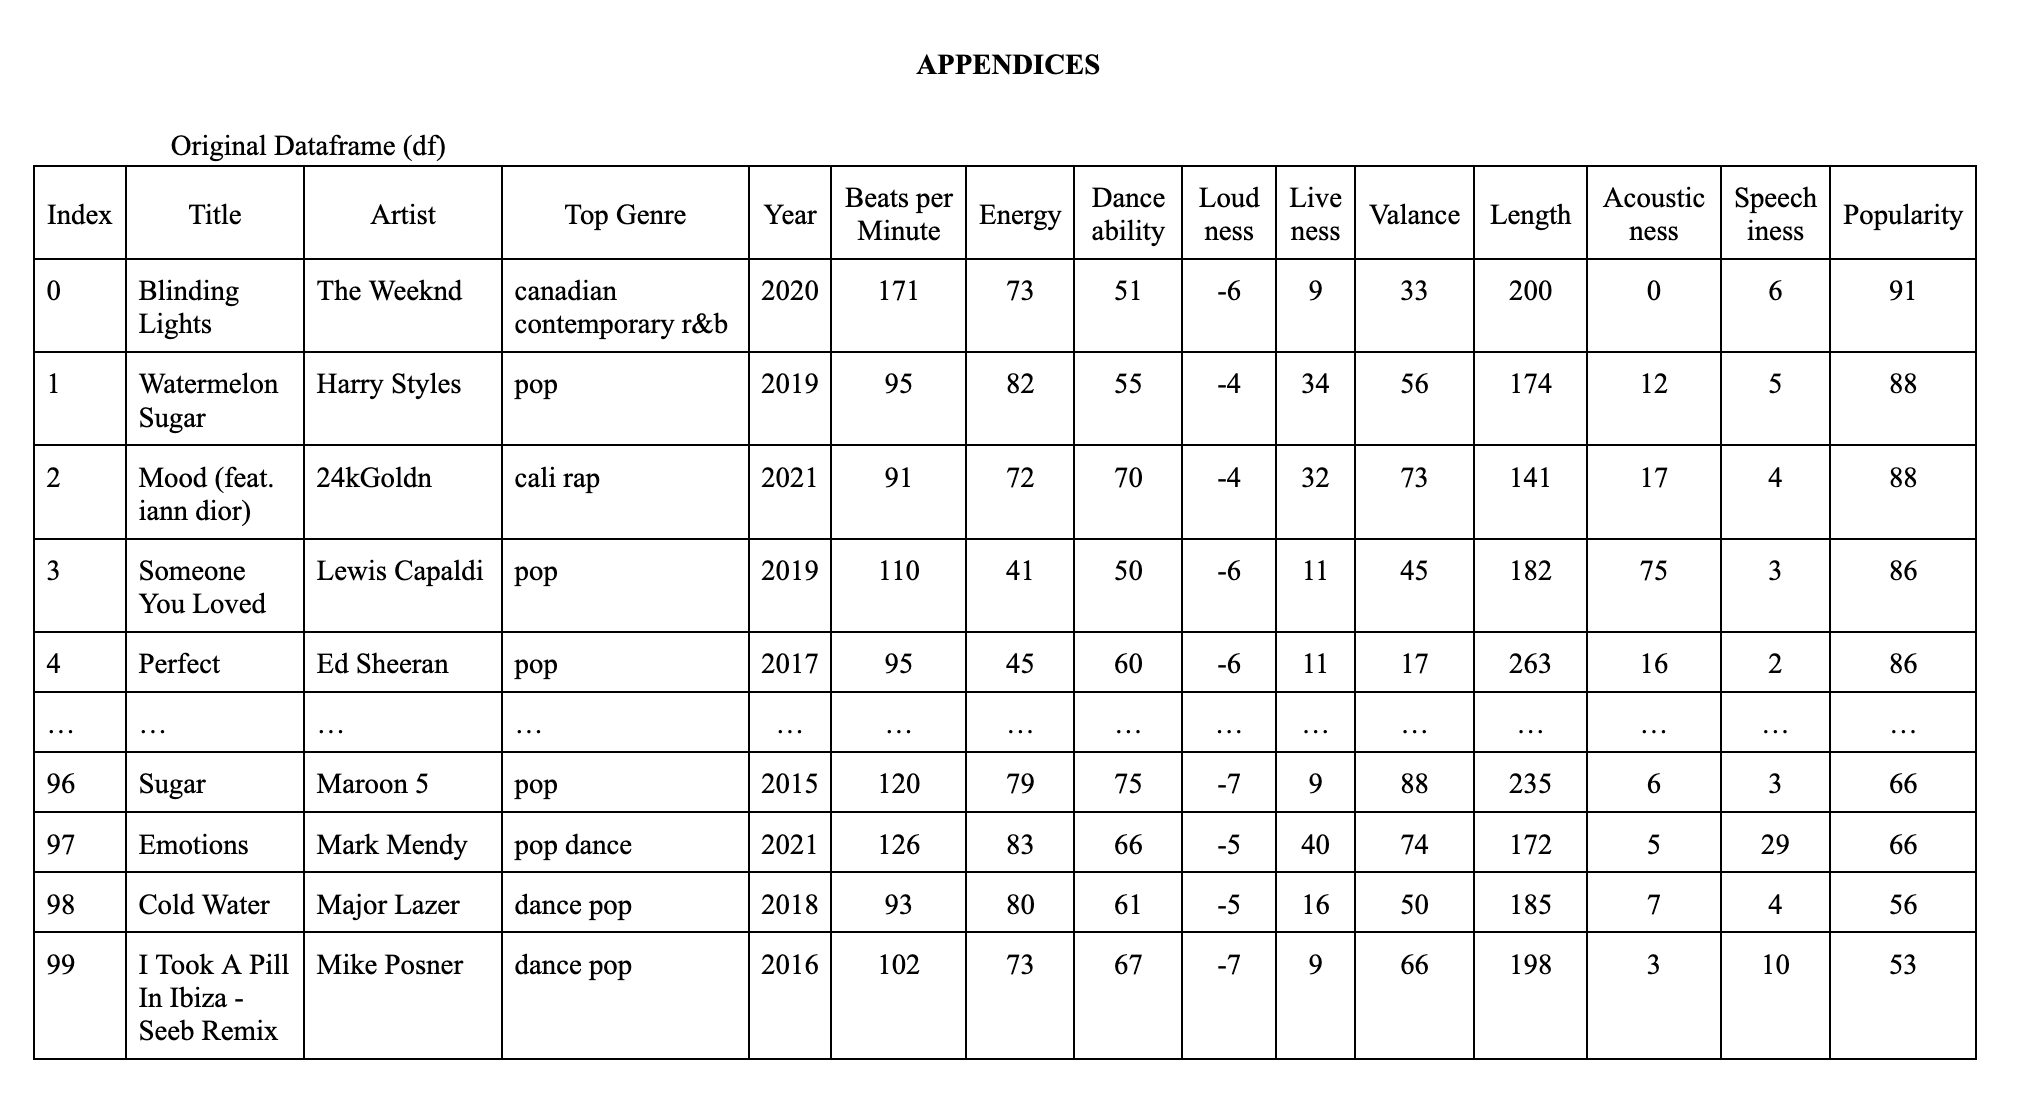
The dataset we use is titled “Top 100 Most Streamed Songs on Spotify” created by Pavankalyan, from the Kaggle website. It contains the top 100 most streamed songs in the world by Spotify from the 90s to 2021 in a CSV file, named Top_100_most_Streamed_-_Sheet1.csv. The dataset is composed of 100 songs and 14 explorable features.
The dataset includes the following features:
- Index: The order of placement of the song’s data
- Title: Name of the song.
- Artist: The main artist/ artists involved in making the song.
- Top genre: All top genres that are often played on Spotify.
- Year: The initial year that the song was released.
- Beats per minute: Show the tempo of each song in the dataset.
- Energy: Measure from 0.0 to 1.0 and represents a perceptual measure of intensity and activity. Typically, energetic tracks feel fast, loud, and noisy.
- Danceability: Describes how suitable a track is for dancing based on a combination of musical elements including tempo, rhythm stability, beat strength, and overall regularity. A value of 0.0 is the least danceable and 1.0 is the most danceable.
- Loudness: The overall loudness of a track in decibels (dB). Loudness values are averaged across the entire track. Values typically range between -60 and 0 dB.
- Liveness: Detects the presence of an audience in the recording. Higher liveness values represent an increased probability that the track was performed live.
- Valance: Calculates how much of a mood level is generated from a song. The higher the value, the more positive mood for the song.
- Length: Shows the duration of the song.
- Acousticness: Describes how acoustic a song is. The higher the value the more acoustic the song is.
- Speechiness: Detects the presence of spoken words in a track. The higher the value the more spoken word the song contains.
- Popularity: Show the popularity of the song. The higher the value, the more popular the song.
Before modifying the dataset in any way, the dataset is described and displayed to provide better insights about the dataset. It is also checked for any missing values, which none was found in this dataset. A column was renamed for a better naming convention. For the prediction target label, a new column named ‘genre_class’ was added. Each row was given a value from 0 to 3 based on the genre of the music, which was identified from the column ‘top_genre’. Only genres which were considered as either pop, rap, rock or hip-hop were included. Genres that were not considered compatible were removed from the data frame, which leaves the dataset with only 88 songs. Afterward, the dataset was split into the training set and test set, with a respective 7:3 ratio.
The example table is in the appendices on the last page of the report
Next Chapter
CHAPTER IV
RESULT AND DISCUSSION

Statistical Test
What statistical test do we use?
If the population standard deviation is known and the sample size is greater than 30, Z-test is recommended to be used. If the population standard deviation is known, and the size of the sample is less than or equal to 30, T-test is recommended. If the population standard deviation is unknown, T-test is recommended (Kumar, 2022).
Z-Test Calculation for Popularity of pop genre:
- n (sample size) of Pop genre (genre_class = 0) = 57
- X (sample data) = [88, 86, 86, 86, 85, 85, 84, 84, 84, 84, 84, 83, 82, 82, 82, 82, 81, 81, 81, 81, 81, 81, 81, 81, 80, 80, 80, 80, 80, 80, 80, 80, 80, 80, 80, 79, 79, 79, 79, 79, 79, 77, 77, 76, 76, 74, 72, 72, 71, 67, 66, 66, 56, 53] = 4497
- Mean of the popularity
- Population/expected mean (μ) = 79.6
- Sample mean (X̄) = sum of the sample genre popularity (pop) / total of the sample genre popularity = Xn=449757=78.9
- Standard error (SE)
SE=n=5.96257=0.789
- Calculate the Z test statistics
Z=(X̄ – μ)SE=(X̄ – μ)n=(78.9 – 79.6)0.789= -0.887
- With alpha = 5% (0.05)
The critical value is 1.6449
The sample mean (78.9) is considered to be almost equal to the population/expected mean (79.6). In other words, the difference between the sample and the population mean is statistically not significant or almost equal based on the Z-test values that shows -0.887 which is lower than the critical value of 1.644. This means that there is not enough evidence to rejected the null Hypothesis (Ho). So it can be concluded that the popularity of pop genre is almost on average (a bit lower than the average score of population) to the average score of the population popularity. This also means that pop genre is not the most popular genre in the dataset.
Anova Calculation for the factors that may effect the popularity of genre:
Low Energy are energies <61, High Energy are energies =>61
Low Valence are valences <50, High Valence are valences =>50


Factor – ENERGY
1. H0 hypothesis
- Since the p-value > α, H0 can not be rejected.
- The averages of all groups assume to be equal. In other words, the difference between the sample averages of all groups is not big enough to be statistically significant. A non-significance result can not prove that H0 is correct, only that the null assumption can not be rejected.
2. P-value
- The p-value equals 0.07356, ( P(x≤3.6667) = 0.9264 ). It means that the chance of a type I error, rejecting a correct H0, is too high: 0.07356 (7.36%). The larger the p-value the more it supports H0.
3. Test statistic
- The test statistic FA equals 3.6667, which is in the 95% region of acceptance: [-∞, 4.494].
4. Effect size
- The observed effect size η2 is large, 0.19. This indicates that the magnitude of the difference between the averages is large.
Factor – VALANCE
1. H0 hypothesis
- Since the p-value < α, H0 is rejected.
- Some of the groups’ averages consider to be not equal. In other words, the sample difference between the averages of some groups is big enough to be statistically significant.
2. P-value
- The p-value equals 0.02391, ( P(x≤6.2256) = 0.9761 ). It means that the chance of a type I error (rejecting a correct H0) is small: 0.02391 (2.39%). The smaller the p-value the more it supports H1.
3. Test statistic
- The test statistic FB equals 6.2256, which is not in the 95% region of acceptance: [-∞, 4.494].
4. Effect size
- The observed effect size η2 is large, 0.28. This indicates that the magnitude of the difference between the averages is large.
Interaction AB
1. H0 hypothesis
- Since the p-value > α, H0 can not be rejected.
- The averages of all groups assume to be equal. In other words, the difference between the sample averages of all groups is not big enough to be statistically significant. A non-significance result can not prove that H0 is correct, only that the null assumption can not be rejected.
2. P-value
- The p-value equals 0.864, ( P(x≤0.0303) = 0.136 ). It means that the chance of a type I error, rejecting a correct H0, is too high: 0.864 (86.4%). The larger the p-value the more it supports H0.
3. Test statistic
- The test statistic FA equals 0.0303, which is in the 95% region of acceptance: [-∞, 4.494].
4. Effect size
- The observed effect size η2 is very small, 0.0019. This indicates that the magnitude of the difference between the averages is very small.
Next chapter
CHAPTER V
CONCLUSION
Music is very distinct from one another. Every song has its own uniqueness which can impact on user’s current state. With this study and dataset, every song has features that are specifically for them and graded by values to differentiate them from each other. According to the Z-test statistics, the comparison between the sample mean (pop genre) and the population mean is not significantly different from one another or it can be said it is almost equal. The results of the tests also matched the null hypothesis, and it can be concluded that pop genre is not the most popular genre and the popularity is around the average. Another statistical test is used, which is using ANOVA to find out whether valence and energy have a significant impact on the popularity of a genre. The result of using ANOVA test shows that valence and energy are not statistically significant, however, with 95% confidence it is 86,4% likely that this hypothesis is wrong due to type 1 error and more samples are needed to minimize this.
REFERENCES
Ajibola, A. (2019). Meaning, Terms, and Characteristics of Music. Retrieved from https://www.len.com.ng/csblogdetail/24/Meaning–Terms-and-Characteristics-of-Music
Bright Horizons. (2022). Children and Music: Benefits of Music in Child Development. Retrieved from https://www.brighthorizons.com/resources/Article/music-and-children-rhythm-meets-child-development
Ivan, L., & Cara, R. (2017). How many Music genres are there? Retrieved from https://askwonder.com/research/music-genres-there-ovchwa91d
IBM. (2021, August 17). How SVM works. Retrieved from https://www.ibm.com/docs/en/spss-modeler/saas?topic=models-how-svm-works
Kanade, V. (2022, May 30). What Is a Decision Tree? Algorithms, Template, Examples, and Best Practices. Retrieved from https://www.spiceworks.com/tech/artificial-intelligence/articles/what-is-decision-tree/
Kumar, A. (2022, February 1). When to Use Z-test vs T-test: Differences, Examples. Data Analytics. https://vitalflux.com/when-to-use-z-test-vs-t-test-differences-examples/#:~:text=If%20the%20population%20standard%20deviation
Illowsky, B. & et al. (2022, June 23). Introductory Statistics. OpenStax. Retrieved from https://assets.openstax.org/oscms-prodcms/media/documents/IntroductoryStatistics-OP_i6tAI7e.pdf
PavanKalyan (2021). Top 100 Most Streamed Songs on Spotify. Retrieved from https://www.kaggle.com/datasets/pavan9065/top-100-most-streamed-songs-on-spotify
Statista. (2021, January 8). Favorite music genres in the U.S. 2018, by age. https://www.statista.com/statistics/253915/favorite-music-genres-in-the-us/
Statista. (2022, September 22). Streamed music consumption in the U.S. 2021, by genre. https://www.statista.com/statistics/475667/streamed-music-consumption-genre-usa/
Statista. (2022a, June 8). Music consumption in the U.S. in 2021, by genre & format. https://www.statista.com/statistics/502908/music-consumption-genre-format-usa/
APPENDICES


Leave a comment